How to Make AI Agents that Run Code
Why do LLMs need code execution?
In the whole architecture of an AI agent application, creating assistants that can provide accurate and relevant answers depends on a sophisticated combination of functionalities. At Khoj, we’ve discovered that effective AI assistance depends on multiple subfunctions working in concert, including intent determination, information retrieval, online searches, webpage scraping, and code execution. We’re going to drill down into the last of these functionalities – code execution – and explore how it enhances LLMs.
The ability to execute code is particularly crucial in current AI assistance. Recent research shows that Large Language Models (LLMs) still have limitations when it comes to quantitative reasoning and data analysis. You can’t just overcome these limitations with prompt engineering.
However, these same models excel at writing code. By connecting an LLM to a code execution environment, we can overcome limitations in quantitative analysis, enabling the LLM to perform calculations, conduct statistical analyses, and generate visual representations of data through charts – all of which contribute to more comprehensive and accurate responses.
How it works
We’ve added a subtask in Khoj that generates Python code to execute in order to fulfill some user intent. This code can be as simple as a mathematical calculation or as complex as charting a graph. The AI agent then executes this code in a sandboxed environment and returns the results to the user. You can see most of the relevant code in run_code.py.
Implementing code execution in AI systems comes with significant security considerations. Running arbitrary LLM-generated Python code, whether on local machines or cloud servers, presents obvious risks that need to be carefully managed. To address these concerns, we’ve leveraged the excellent work done by Pyoidide to run python in a js sandbox and Cohere’s Terrarium to containerize it as a service. We’ve wrapped into a publically accessible docker base image accessible at ghcr.io/khoj-ai/terrarium:latest. You can see the code on our Terrarium fork on GitHub.
To run it, you can use the following command:
docker run -p 8080:8080 ghcr.io/khoj-ai/terrarium:latestTo test it, you can use the following Python code:
curl -X POST -H "Content-Type: application/json" \
--url http://localhost:8080 \
--data-raw '{"code": "1 + 1"}' \
--no-buffer
This approach to AI assistance, combining natural language with LLMs and code execution capabilities, represents a significant step forward in creating more capable and useful AI systems. As we continue to develop and refine these tools, we’re discovering new ways to bridge the gap between human inquiry and computational analysis, all while maintaining security and user accessibility.
See an Example
One of the most compelling features of this implementation is the integration with matplotlib, the canonical Python charting library. This integration allows our AI assistant to generate rich visual outputs, including sophisticated charts and documents, directly within the conversation interface. This capability transforms the interaction from purely textual exchanges to more comprehensive and visually informative communications.
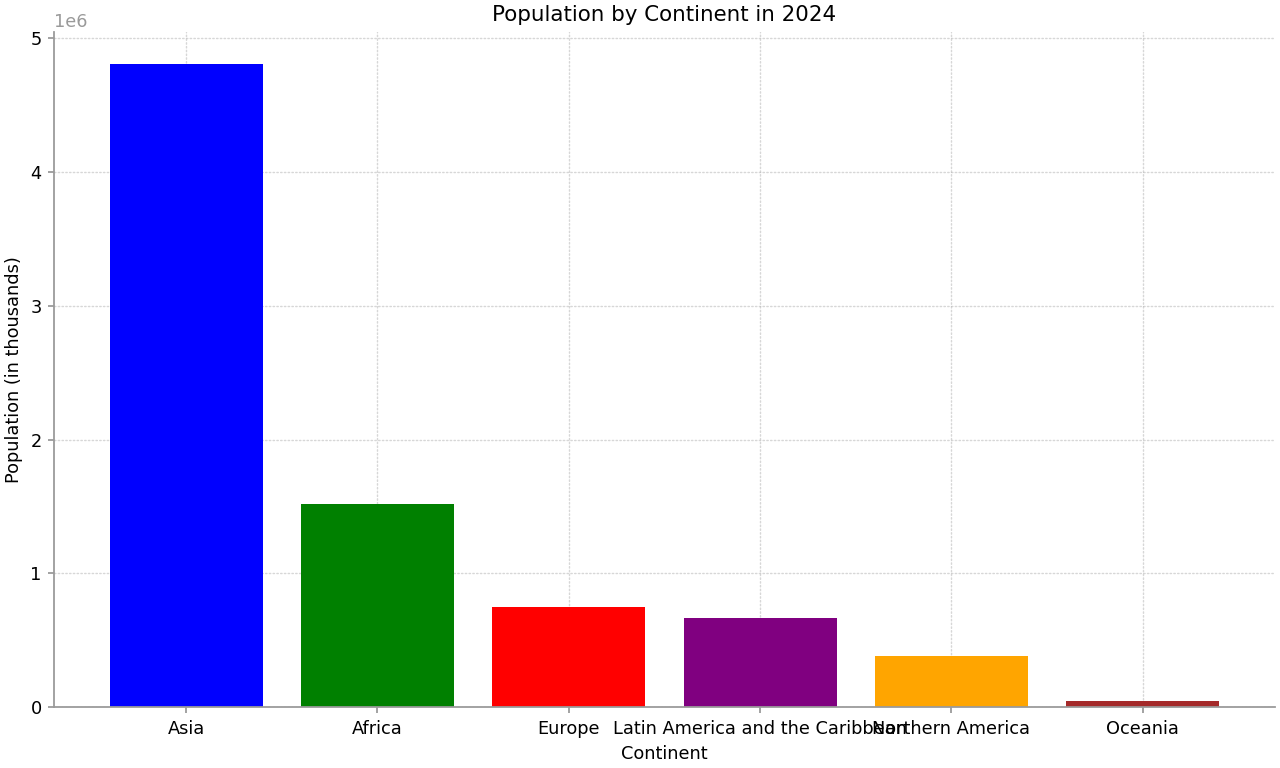
Here’s an example of a chart Khoj created. My query was: “create a chart comparing the number of people in each continent. use a bar chart.”. See full conversation:

You can also see the code it executed. In this case, it ran:
import matplotlib.pyplot as plt

# Data for population by continent in 2024
continents = ['Asia', 'Africa', 'Europe', 'Latin America and the Caribbean', 'Northern America', 'Oceania']
populations = [4806898, 1515141, 745084, 663466, 385295, 46089]  # in thousands

# Create a bar chart
plt.figure(figsize=(10, 6))
plt.bar(continents, populations, color=['blue', 'green', 'red', 'purple', 'orange', 'brown'])

# Add titles and labels
plt.title('Population by Continent in 2024')
plt.xlabel('Continent')
plt.ylabel('Population (in thousands)')

# Save the plot to a file
plt.savefig('population_by_continent_2024.png')
The Interface
Because one of our core principles is transparency and accessibility of AI, we always show the code executed by the AI assistant. This practice not only helps users understand the process behind the AI’s responses but also allows reproducibility and verification of the results.
The evolution of this functionality within the constraints of a chat interface presents an interesting paradigm. While some argue that chat interfaces are not the future of AI interaction, our experience suggests otherwise. The chat input box represents an open canvas of possibilities, where the response can contain various forms of output – from text to charts to complex analyses. We’re still working on the exact modality of communicating these expanding capabilities to users, but the blinking cursor in the chat box continues to be a compelling invitation to explore & create.